From 2014 to 2019 how were the Real Estate Property Transactions in Spain distributed by Autonomous Community?
After analyzing the growth rate experienced in the Total Number of Real Estate Property Transactions carried out in Spain by Autonomous Community for the period from 2014 to 2019 (link below), and the percentage of the Total Number of Transactions that the Autonomous Communities accounted for in 2019, now this later data for the extended period from 2014 to 2019 will be outlined. The source of the data analyzed is the Statistical Bulletin ( Boletín Estadístico) of the Spanish government.
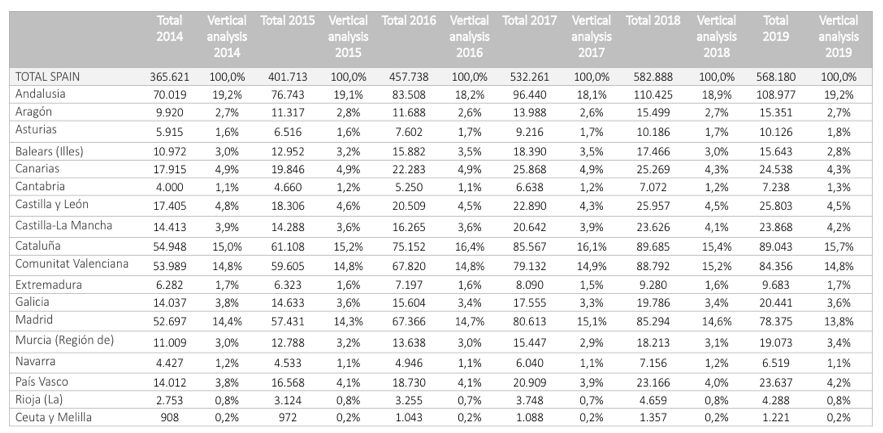
Total Number of Real Estate Property Transactions by Autonomous Community vertical analysis 2014-19

From the table we can appreciate the following:
Andalusia: In 2014, Andalusia accounted for 19,2% (70.019) of the total real estate property transactions in Spain, 19,1% in 2015 (76.743), 18,2% in 2016(83.508), 18,1% in 2017 (96.440), 18,9% in 2018 (110.425), and 19,2% in 2019 (108.977).
Aragon: Within Spain, Aragon accounted for 2,7% of the property transactions in 2014 (9.920), 2,8% in 2015 (11.317), 2,6% in 2016 (11.688), and 2017 (13.988), 2,7% in 2018 (15.499), and 2019 (15.351).
Asturias: In 2014, Asturias accounted for 1,6% of the property transactions in Spain (5.915), and 2015(6.516), 1,7% in 2016 (7.602), 2017(9.216), and 2018 (10.186), and 1,8% in 2019(10.126).
Balears (Illes): The Illes Balears accounted for 3% in 2014 of the total property transactions in Spain (10.972), 3,2% in 2015 (12.952), 3,5% in 2016 (15.882), and 2017 (18.390), 3% in 2018 (17.466), and 2,8% in 2019 (15.643).
Canarias: Canarias represented 4,9% of the total property transactions in Spain in 2014 (17.915), 2015 (19.846), 2016 (22.283), and 2017,(25.868), 4,3% in 2018 (25.269), and 2019(24.538)
Cantabria: Within Spain, Cantabria accounted for 1,1% of the property transactions in 2014 (4000), 1,2% in 2015 (4.660), 1,1% in 2016 (5.250), 1,2% in 2017 (6.638), and 2018 (7.072), and 1,3% in 2019 (7.238).
Castilla y Leon: In 2014, Castilla y Leon accounted for 4,8% of the total property transactions in Spain (17.405), 4,6% in 2015 (18.306), 4,5% in 2016 (20.509), 4,3% in 2017 (22.890), 4,5% in 2018 (25.957), and 2019 (25.803).
Castilla la Mancha: In 2014, Castilla la Mancha represented 3,9% in 2014 (14.413), 3,6% in 2015(14.288), and 2016 (16.265), 3,9% in 2017 (20.642), 4,1% in 2018 (23.626), and 4,2% in 2019 (23.868).
Cataluña: Within Spain, Cataluña accounted for 15% of the total transactions in Spain (54.948), 15,2% in 2015(61.108), 16,4% in 2016 (75.152), 16,1% in 2017(85.567), 15,4% in 2018 (89.685), and 15,7% in 2019 (89.043).
Communitat Valenciana: From the total property transactions carried out in Spain in 2014, Communitat Valenciana accounted for 14,8% of the transactions (53.989), 2015 (59.605), and 2016 (67.820), 14,9% in 2017(79.132), 15,2% in 2018 (88.792), 14,8% in 2019 (84.356).
Extremadura: In 2014, Extremadura accounted for 1,7% of the total property transactions in Spain (6.282), 1,6% in 2015(6.323), and 2016 (7.197), 1,5% in 2017 (8.090),1,6% in 2018 (9.280), and 1,7% in 2019 (9.683).
Galicia: Galicia accounted for 3,8% of the total property transactions in Spain in 2014 (14.037, 3,6% in 2015 (14.633), 3,4% in 2016 (15.604), 3,3% in 2017 (17.555), 3,4% in 2018 (19.786), and 3,6% in 2019 (20.441).
Madrid: In 2014, Madrid accounted for 14,4% of the total property transactions in Spain (52.697), 14,3% in 2015 (57.431), 14,7% in 2016 (67.366), 15,1% in 2017 (80.613), 14,6% in 2018 (85.294), and 13,8% in 2019 (78.375).
Murcia: From the total property transactions carried out in Spain, Murcia represented 3% in 2014 (11.009), 3,2% in 2015 (12.788), 3% in 2016 (13.638), 2,9% in 2017 (15.447), 3,1% in 2018 (18.213), and 3,4% in 2019 (19.073).
Navarra: Navarra, accounted for 1,2% on the total property transactions carried out in Spain in 2014 (4.427), 1,1% in 2015 (4.533), 2016 (4.946), and 2017 (6.040), 1,2% in 2018 (7.156), and 1,1% in 2019 (6.519).
Pais Vasco: In 2014, Pais Vasco accounted for 3,8% of the total property transactions in Spain (14.012), 4,1% in 2015 (16.568), and 2016 (18.730), 3,9% in 2017 (20.909), 4% in 2018 (23.166), and 4,2% in 2019(23.637).
La Rioja: Within Spain, La Rioja accounted for 0,8% of the total property transactions in 2014 (2.753), and 2015 (3.124), 0,7 % in 2016 (3.255), and 2017 (3.748), 0,8% in 2018 (4.659), and 2019 (4.288).
Ceuta y Melilla: In 2014, from the total property transactions carried out in Spain, Ceuta and Melilla represented 0,2% (908), and continued to represent 0,2% in 2015 (972), 2016 (1.043), 2017 (1.088), 2018(1.357), and 2019 (1.221).

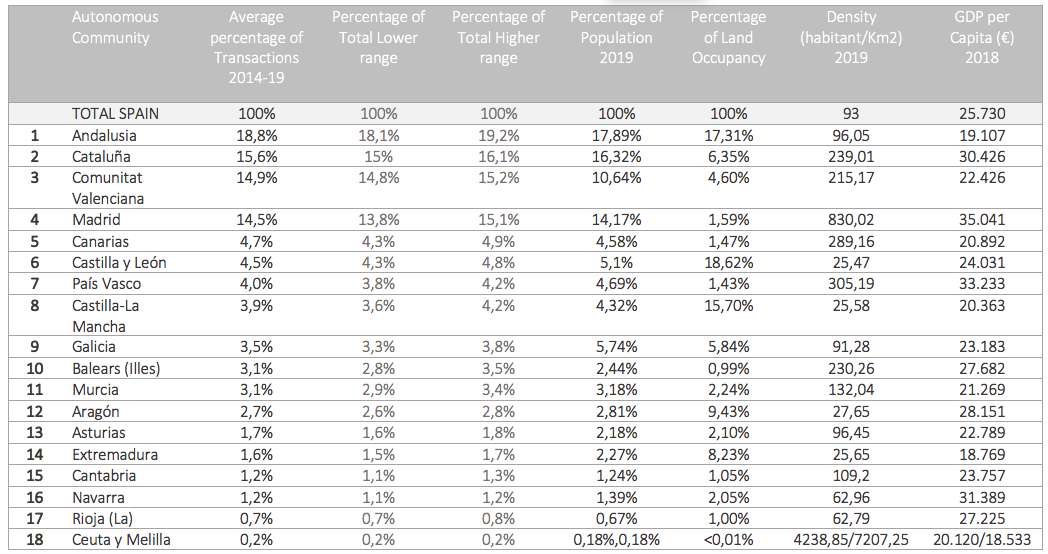
Following the data outlined above, in the next table the Autonomous Communities are organized and illustrated in terms of the weight that they individually represent as a percentage of the Total Number of Real Estate Property Transactions that were carried out in Spain from 2014 to 2019. From the total annual values for this period, the average percentage has been calculated, and we can appreciate that the Autonomous Community that has represented the largest proportion in terms of number of transactions for this period is Andalusia, followed by Cataluña, Communitat Valenciana, Madrid, Canarias, Castilla y León, País Vasco, Castilla la Mancha, Galicia, Illes Balears, Murcia, Aragón, Asturias, Extremadura, Cantabria, Navarra, La Rioja, and Ceuta and Melilla.
The Lower and Higher ranges for the percentage of transactions have been calculated from 2014 to 2019 for each Autonomous Community. The variation in the annual percentage has by logic depended on the growth rate experienced simultaneously within the Autonomous Communities. For example, comparing 2018 to 2019 we realize that Andalusia, Cataluña, Murcia, Galicia, País Vasco, Asturias, Cantabria, Castilla la Mancha, and Extremadura increased the proportion that they each represented of the Total Real Estate Property Transactions that were carried out in Spain from 2018 to 2019. The increase in percentage is at the expense of other Autonomous Communities that has decreased the proportion that they represent, which from 2018 to 2019 were Madrid, the Communitat Valenciana, followed by Illes Balears and Navarra. On the other hand, Aragon, Canarias, Castilla y Leon, La Rioja and Ceuta and Melilla remained somewhat stable in the proportion they represented both in 2018 and 2019.
When we gather this information together with the percentages for annual growth rates analyzed in the previous article (link below) we can also appreciate that the areas that lost weight as a percentage of the Total Number of Real Estate Property Transactions carried out in Spain were the areas that had the highest negative growth rates, and the areas that increased their weight had a better annual growth rate from 2018 to 2019, or the least negative growth rate.
In the case of Autonomous Communities that represents a smaller proportion of transactions from the Total Transactions carried out in Spain, such as Ceuta and Melilla, that only represents 0,2%, even if a negative growth rate of -10% was experienced from 2018-19, the proportion that the transactions represents from the total is minimum, thus too small to have an overall effect. On the contrary, in the Autonomous Communities that accounts for a large proportion of the Total Real Estate Property Transactions in Spain such as Madrid, Cataluña, Communitat Valenciana and Andalusia, the effect is significant. It is to be highlighted that these four Autonomous Communities accounts for over 60% of the Total Number of Real Estate Property Transactions in Spain, for over 50% of the Total Population in Spain, and almost 30% of the Land in Spain.
In the Table below, also outlined is the percentage of population, the land occupancy percentage, the density in terms of habitant per square kilometer, and the GDP per capita for every Autonomous Community as officially registered by the Autonomies. The highest GDP per capita locations has been favored the most by "build to rent" investments, where Madrid, País Vasco, Navarra, and Cataluña have been the Communities with the highest GDP per capita. In future articles we will analyze the values of transactions and these additional figures more in depth.

While the annual growth in the Total Number of Real Estate Property Transactions in Spain is not constant and show significant variations, the proportion of the Total Transactions that each Autonomous Community represents from the Total Real Estate Property Transactions in Spain, reflects more stability, although with some minor exception in Andalusia, Cataluña and Madrid, the interval between the highest and lowest percentage range point is mostly less than 1% in variation. In the following article we will have a closer look at the evolution in growth of the New and Resale Property Transactions for the Autonomous Communities during this same period.
Lower and Higher range percentage rates of the Total Number of Real Estate Property Transactions in Spain by Autonomous Community 2014-19

