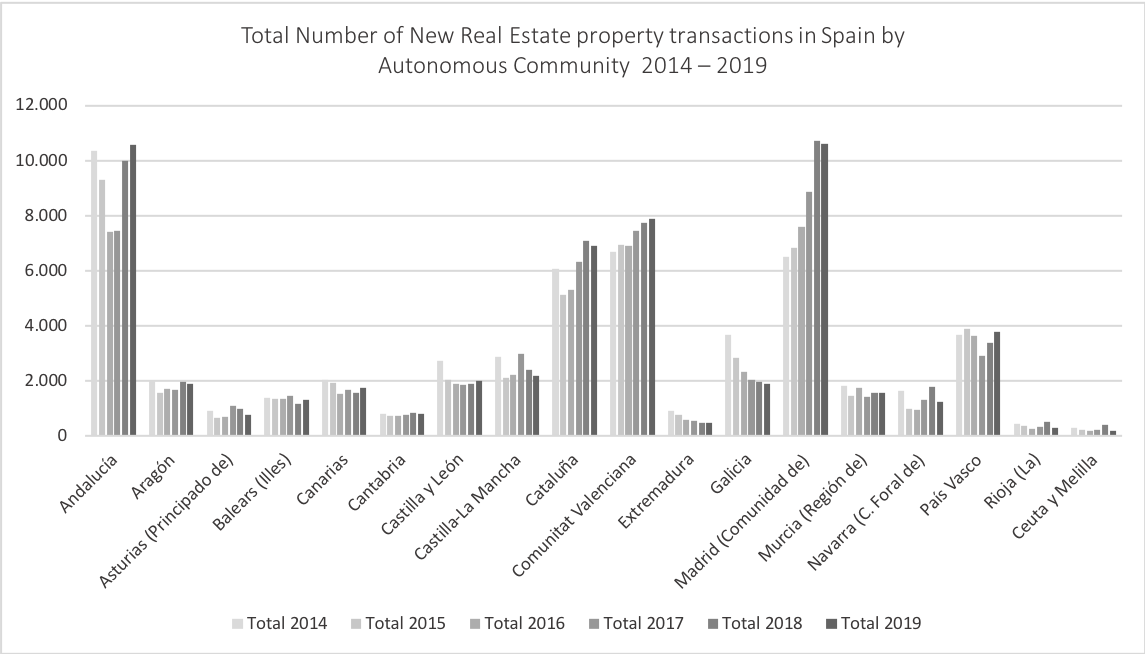
New Real Estate Property Transactions in Spain distributed by Autonomous Community from 2014 to 2019
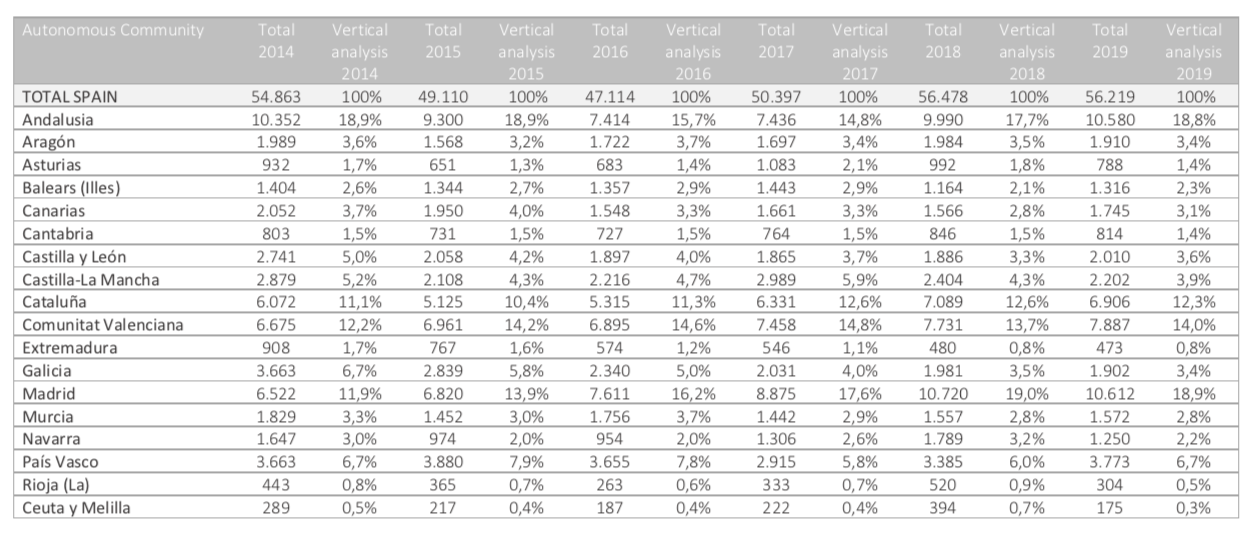
Initially to illustrate the data, the following table includes a vertical analysis that outlines the percentage of the Total Number of New Real Estate Property Transactions that each Autonomous Community represented from 2014 -19.

From the table we can appreciate the following:
Andalusia: In 2014, Andalusia accounted for 18,9% (10.352) of the total number of new real estate property transactions in Spain, 18,9% in 2015 (9,300), 15,7% in 2016(7.414), 14,8% in 2017 (7.436), 17,7% in 2018 (9.990), and 18,8% in 2019 (10.580).
Aragon: Within Spain, Aragon accounted for 3,6% of the total number of new real estate property transactions in 2014 (1.989), 3,2% in 2015 (1.568), 3,7% in 2016 (1.722), 3,4% in 2017 (1.697), 3,5% in 2018 (1.984), and 3,4% 2019 (1.910).
Asturias: In 2014, Asturias accounted for 1,7% of the the total number of new real estate property transactions in Spain (932), 1,3% in 2015(651), 1,4% in 2016 (683), 2,1% in 2017(1.083), 1,8% in 2018 (992), and 1,4% in 2019(788).
Balears (Illes): The Illes Balears accounted for 2,6% in 2014 of the total number of new real estate property transactions in Spain (1.404), 2,7% in 2015 (1.344), 2,9% in 2016 (1.357), and 2017 (1.443), 2,1% in 2018 (1.164), and 2,3% in 2019 (1.316).
Canarias: Canarias represented 3,7% of the total new real estate property transactions in Spain in 2014 (2.052), 4% in 2015 (1.950), 3,3% in 2016 (1.548), and 2017, (1.661), 2,8% in 2018 (1.566), and 3,1% in 2019(1.745).
Cantabria: Within Spain, Cantabria accounted for 1,5% of the total number of new real estate property transactions in 2014 (803), 2015 (731), 2016 (727), 2017 (764), and 2018 (846), and 1,4% in 2019 (814).
Castilla y Leon: In 2014, Castilla y Leon accounted for 5% of the total number of new property transactions in Spain (2.741), 4,2% in 2015 (2.058), 4% in 2016 (1.897), 3,7% in 2017 (1.865), 3,3% in 2018 (1.886), and 3,6% in 2019 (2.010).
Castilla la Mancha: In 2014, Castilla la Mancha represented 5,2% in 2014 (2.879) of the total number of new real estate property transactions in Spain, 4,3% in 2015(2.108), 4,7% in 2016 (2.216), 5,9% in 2017 (2.989), 4,3% in 2018 (2.404), and 3,9% in 2019 (2.202).
Cataluña: Within Spain, Cataluña accounted for 11,1% of the total number of new real estate property transactions in Spain (6.072), 10,4% in 2015(5.125), 11,3% in 2016 (5.315), 12,6% in 2017(6.331), and in 2018 (7.089), and 12,3% in 2019 (6.906).
Communitat Valenciana: From the total number of new real estate property transactions carried out in Spain in 2014, the Communitat Valenciana accounted for 12,2% of the new property transactions (6.675), 14,2% in 2015 (6.961), 14,6% in 2016 (6.895), 14,8% in 2017(7.458), 13,7% in 2018 (7.731), 14% in 2019 (7.887).
Extremadura: In 2014, Extremadura accounted for 1,7% of the total number of new real estate property transactions in Spain (908), 1,6% in 2015(767), 1,2% in 2016 (574), 1,1% in 2017 (546), 0,8% in 2018 (480), and in 2019 (473).
Galicia: Galicia accounted for 6,7% of the total number of new real estate property transactions in Spain in 2014 (3.663), 5,8% in 2015 (2.839), 5% in 2016 (2.340), 4% in 2017 (2.031), 3,5% in 2018 (1.981), and 3,4% in 2019 (1.902).
Madrid: In 2014, Madrid accounted for 11,9% of the total number of new real estate property transactions in Spain (6.522), 13,9% in 2015 (6.820), 16,2% in 2016 (7.611), 17,6% in 2017 (8.875), 19% in 2018 (10.720), and 18,9% in 2019 (10.612).
Murcia: From the total number of new real estate property transactions carried out in Spain, Murcia represented 3,3% in 2014 (1.829), 3% in 2015 (1.452), 3,7% in 2016 (1.756), 2,9% in 2017 (1.442), 2,8% in 2018 (1.557), and in 2019 (1.572).
Navarra: Navarra, accounted for 3% on the total number of new real estate property transactions carried out in Spain in 2014 (1.647), 2% in 2015 (974), and 2016 (954), 2,6% in 2017 (1.306), 3,2% in 2018 (1.789), and 2,2% in 2019 (1.250).
Pais Vasco: In 2014, Pais Vasco accounted for 6,7% of the total number of new real estate property transactions in Spain (3.663), 7,9% in 2015 (3.880), 7,8% in 2016 (3.655), 5,8% in 2017 (2.915), 6% in 2018 (3.385), and 6,7% in 2019(3.773).
La Rioja: Within Spain, La Rioja accounted for 0,8% of the total number of new real estate property transactions in 2014 (443), 0,7% in 2015 (365), 0,6 % in 2016 (263), 0,7% in 2017 (333), 0,9% in 2018 (520), and 0,5% in 2019 (304).
Ceuta y Melilla: In 2014, from the total number of new real estate property transactions carried out in Spain, Ceuta and Melilla represented 0,5% (289), 0,4% in 2015(217), 2016 (187), 2017 (222), 0,7% in 2018(394), and 0,3% in 2019 (175).

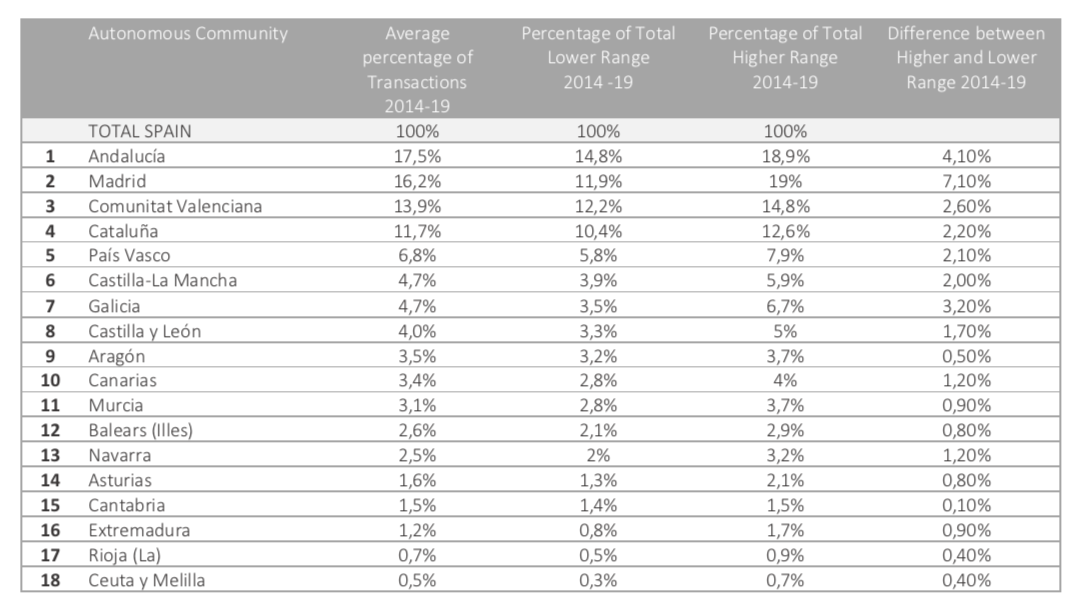
The Lower and Higher ranges for the proportionate percentage of transactions is outlined from 2014 to 2019 for each Autonomous Community. The variation in the annual percentage has by logic depended on the growth rate experienced simultaneously within the Autonomous Communities, which we will look more closely into when analyzing the percentages of annual growth for the New Real Estate Property Transactions for this same period.

When previously analyzing the annual growth of the Total Number of Real Estate Property Transactions in Spain for the period from 2014 to 2019, and the distribution by Autonomous Community, we realized that while the annual growth rates didn’t experience stable patterns of growth, the proportionate percentage of transactions that the Autonomous Communities represented of the Total Transactions annually, showed higher levels of stability. With the exception of Madrid, Cataluña and Andalusia, less than 1% variation between the lower and higher range percentages for the period from 2014 to 2019 was seen among the Autonomous Communities in terms of the Total Real Estate Property Transactions they accounted for.
Within this Total Number of Real Estate Property Transactions, when analyzing the proportion of New Real Estate Property Transactions by Autonomous Community, we can appreciate that there are larger variations between the lowest and highest range percentages that the Autonomous Communities have represented for the same period annually, than when analyzing the Total Number of Real Estate Property Transactions in Spain all together.
As in line with the analysis of the Total transactions, Madrid and Andalusia are the Autonomous Communities that has experienced the largest changes in the percentages that they accounted for annually when analyzing the Number of New Real Estate Property Transactions, followed by Galicia, the Communitat Valenciana, Cataluña, País Vasco, Castilla la Mancha Castilla y Leon, Canarias and Navarra. The remaining Autonomous Communities has maintained variations between the higher and lower ranges of less than 1% from 2014-19. This information on New Properties needs to be analyzed together with the Total Number of Resale Real Estate Property Transactions to get the whole picture, which will be consecutively done in future articles.
In the next article the annual growth rates will be analyzed for the New Property Transactions, before going on to analyze Resale Property Transactions by Autonomous Community for the same period from 2014 to 2019.
